Am 25.04. fand der jährliche Girls' Day statt und wir durften der 3. Klasse des BG/BRG Frauengasse aus Baden einen Einblick in die Welt von Statistik Austria geben.
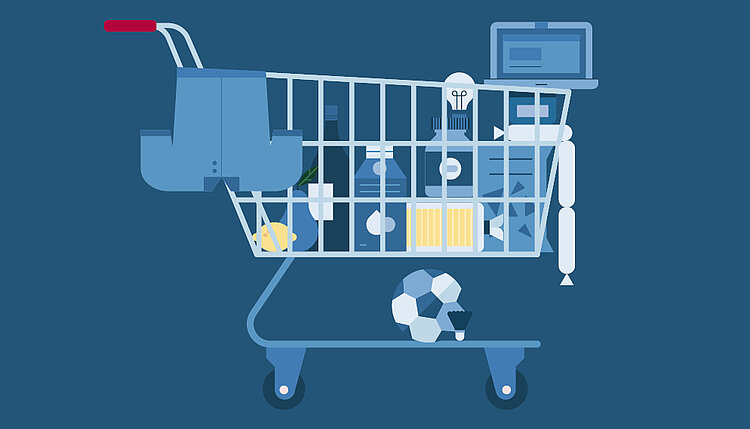
Wie viel geben Menschen in Österreich fürs Wohnen aus? Wie viel für Lebensmittel, Bekleidung, Freizeit, Mobilität, Gesundheit und Bildung? Alle fünf Jahre befragt Statistik Austria rund 7 000 Haushalte zu ihren Konsumausgaben.
Wir zeigen, wie man faktenbasierte Daten für (vor-)wissenschaftliche Arbeiten leicht findet und geben einen Einblick, was Statistik Austria leistet.